Dashboard
 Supplier | Dashboard
The display for the dashboard that appears in the Production menu is configured here. The options for dashboard items can be selected from production and quality results and scheduling information. Display options can be adjusted for user requirements and preferences.
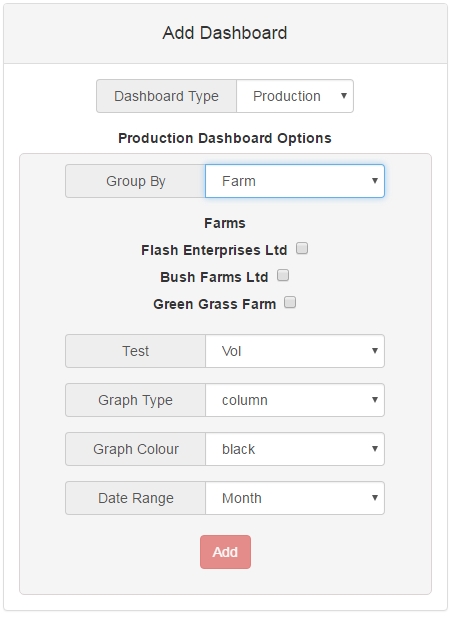
- From the Add Dashboard option, select Production from the Dashboard Type drop down box:
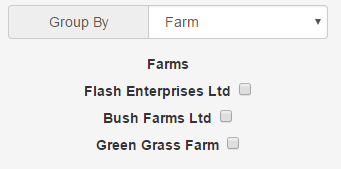
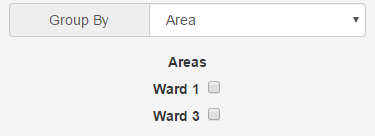
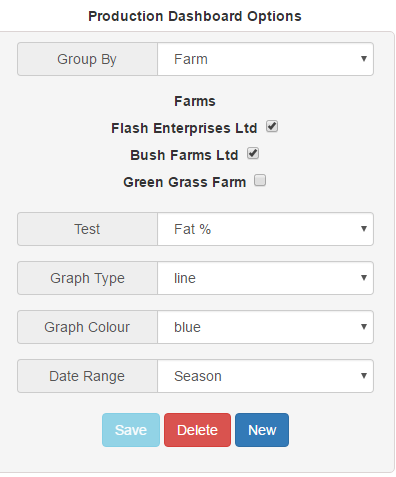
- Select the Group By option by selecting either Farm or Area from the drop down box. The group by option will display the production results for the options you select here. Selecting Farm will display the results for the selected farm options. Selecting Area will display the selected results for the geographical area.
- Tick the check boxes for the group by option you have chosen.
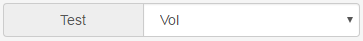
- Select from the available test types fro m the Test drop down box to determine which results are to be viewed :
- The graph display type on the dashboard can be selected from either column, line or area:
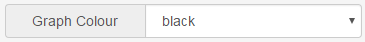
- Select the graph colour from the options in the drop down box. The Graph colour determines the colour used to display the results in.
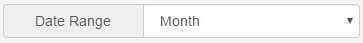
- Select the Date range for displaying results. This can be selected by month or season:
- Click the
 button. The dashboard item will be shown under the Current Dashboard Items heading and available to view from the Production | Dashboard menu.

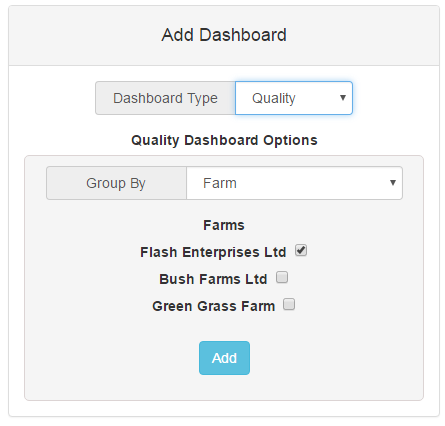
- From the Add Dashboard option, select Quality from the Dashboard Type drop down box:
- Select the Group By option by selecting either Farm or Area from the drop down box. The group by option will display the production results for the options you select here. Selecting Farm will display the results for the selected farm options. Selecting Area will display the selected results for the geographical area.
- Tick the check boxes for the group by options you have chosen.
- Click the button. The dashboard item will be shown under the Current Dashboard Items heading and available to view from the Production | Dashboard menu.
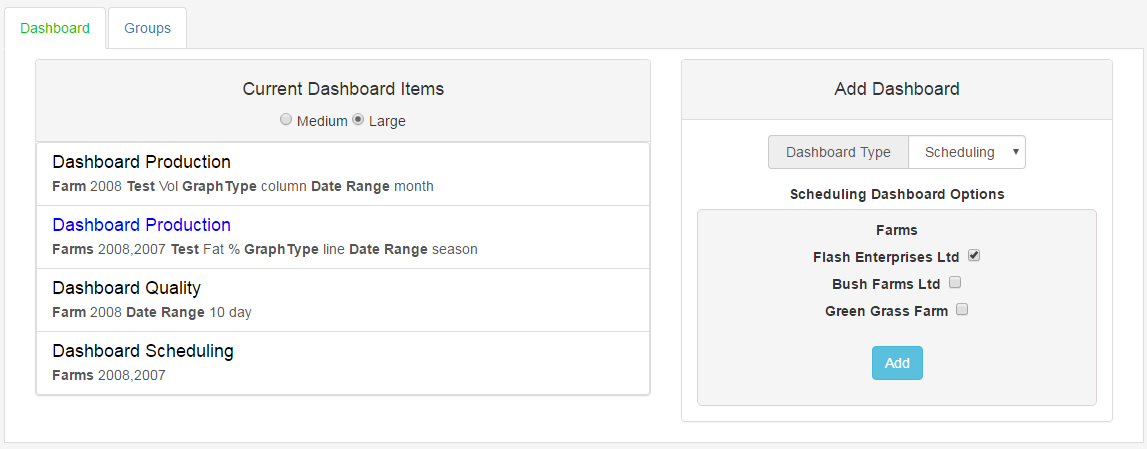
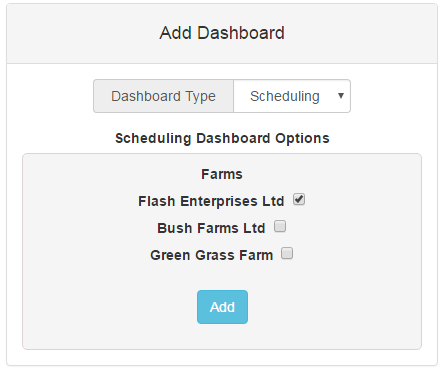
- From the Add Dashboard option, select Scheduling from the Dashboard Type drop down box:
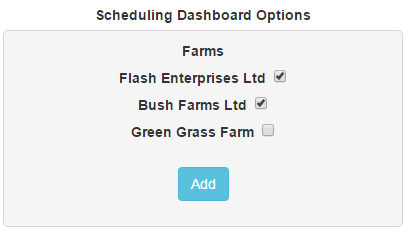
- Tick the check boxes for the farms you wish to see scheduling information for:
- Click the button. The dashboard item will be shown under the Current Dashboard Items heading and available to view from the Production | Dashboard menu.
- To edit or delete a dashboard item, click on the existing dashboard item you wish to alter:
- If you are editing an item, you can alter the Group By ,Test, Graph Type, Graph Colour and Date Range options. Click Save to permanently change the dashboard item.
- If you wish to delete the dashboard item click the Delete button.
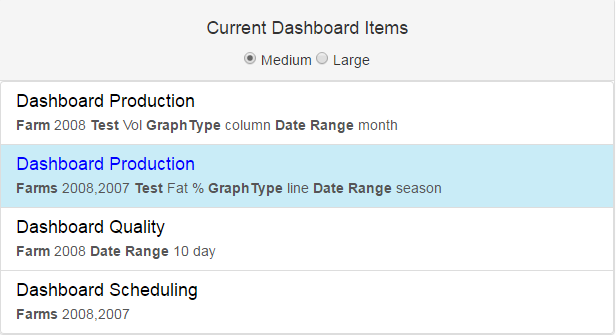
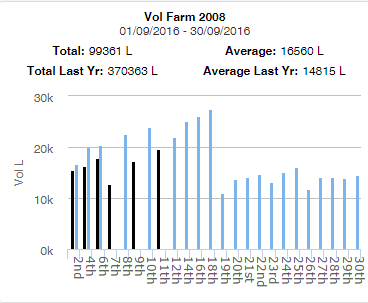
The display size of dashboard items can be specified by checking the medium or large option underneath the Current Dashboard Items heading. The option selected will apply to all items on the dashboard and not individual items. The size can be changed at anytime and the changes will take immediate effect.
Medium Option
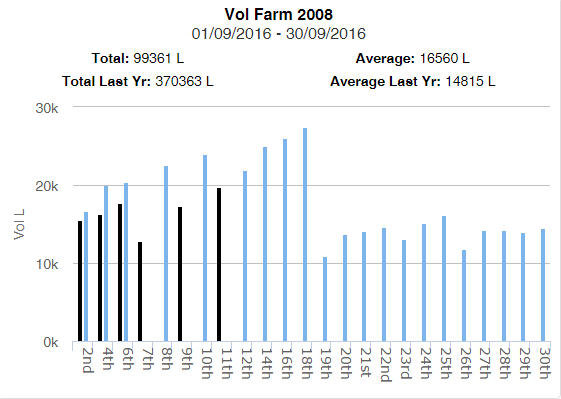
Large Option

|